Software Toolkit for Generalists (pt 3)
Modeling Nuances
This isn’t meant to teach you how to model like a second year analyst, but simply to point out the unique aspects of traditional asset-light software.
First a few definitions:
Bookings: The value of customer contracts signed in a given period
Billings: The value of customer invoices in a given period
Deferred Revenue: A balance sheet liability created the customer is invoiced but services are not yet delivered
Remaining Performance Obligation (RPO): Essentially a superset of deferred revenue plus all the binding contractual customer commits you have signed but not billed or invoiced
Capitalized Software: Normally when you think of R&D, it’s an income statement expense. But some companies will “capitalize” a portion of that R&D expense, which is to say they put it on the balance sheet as an asset then amortize it over time (usually 2-5 years). There are GAAP principals to allow for it in some stages of development. The issue it creates for investors is that it makes comparisons more challenging across peers often we “reverse” the capitalization for apples to apples comparison.
Go-live and Provisioning: Go-live is the “launch” moment when the system is deployed in a live production environment, users have access, required data is migrated, support desk is in place to help resolve issues and tools are deployed to monitor operational health. In contrast, Provisioning is when the vendor has delivered access to the system based on contract terms (e.g. tenancy and accounts are set up, 3rd party integrations required are done) but there other steps that may be needed for go-live to occur. Different types of contracts will differ when revenue recognition starts but its not hard to see that SW vendors will push as much as their obligation to end at provisioning in order to achieve faster rev rec.
Seasonality
Yes, certain industries will always be subject to seasonality and seasonal budgets (e.g. marketing budgets, retail budgets). But by and large, software is driven by fiscal quarter end incentives. Whether Q4 is in December or April isn’t as important (generally speaking) than the sales incentives put in place to drive behavior such as allowing reps more discounting in certain quarters.
Sales Roles
Before getting into ARR and revenue, it's good to understand typical sales roles within a cookie cutter software business. As talked about in part 2, this is the single biggest toggle a company has to make changes. As an investor (as opposed to an operator), this isn’t meant to be a deep dive of sales ops efficiency.
The machinery starts with trying to figure out the right number of reps relative to demand. Too many reps, spend is too high and productivity is too low. Too few reps, opportunities are not adequately covered.
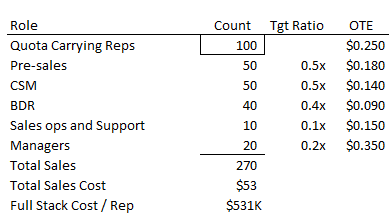
Reps: Carry a quota, on-target earnings (OTE) is levered towards commissions. A person who is capable of being trained on how to position a product and move deals along the various sales stages to closing.
Pre-sales (Sometimes called a sales engineer): This is a critical role in that the rep is just a account manager, the pre-sales team is the ones who actually understands the product and how to demo. Typically speaking, once a deal is qualified, a rep will bring in a pre-sales person to lead the next level technical discussion. Usually paid in some form of a pooled bonus.
Customer Success Manager (CSM): After an account is won, the CSM takes over the account and is responsible for that account, including renewal and CSAT. Sometimes the job of upselling to that customer gets moved over to the CSM org, sometimes it stays with the reps. Comp has elements of commissions, particularly tied to renewals but not as levered as a rep.
Business Develop Rep (BDR): More often than not, when you see a tiktok video of a tech sales bro out of college, that’s a BDR. Entry level role, responsible for generating leads that get handed off to a rep. Total comp is lower and good performers can graduate to a rep as a career path.
Sales ops and support: Wide gamut of indirect revenue generating roles such as alliances and partnerships, to sales support functions like operations, comp and commission planning or sales finance or deal desk. The back-office of sales.
Managers: Everything from a CRO down to managers of individual sales functions. Leadership is important but these roles arent meant to be directly closing day to day deals as their success is tied to the “roll-up” numbers of the entire team.
This is just one of many examples of how you might measure the sales organization with target ratios tied to number of reps to arrive at an all-in expense/rep.
New Bookings
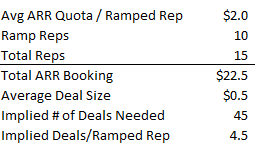
There’s no shortage of ways you can build a few hundred rows to get to total bookings but its usually a combination of capacity based (how many reps can we onboard) or demand based (how many deals to close a quarter).
Quota setting, commission setting are fairly complex activities but for modeling purposes suffice to say that a fully ramped rep will be much more productive than a new hire that usually has 6-9 months grace period to learn before being required to make some level of quota.
You can triangulate the numbers of deals you need, or in the reverse. End of the day its more an art than a science. As a public market investor, this is more about understanding the factory line because in reality, you do not have access to this level of information.
In businesses with usage/consumption pricing, the model without customer committed spend becomes less predictable outside of the base platforms fees. Typically it involves a level forecasting with the customer and a heavy portion of the reps commission is then tied to customer consumption to align incentives.
Bookings to Revenue (Basic Concept)
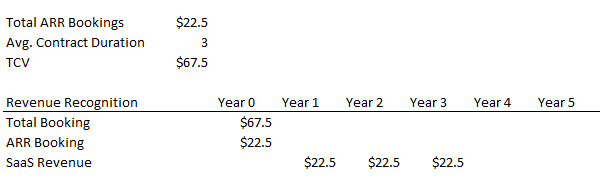
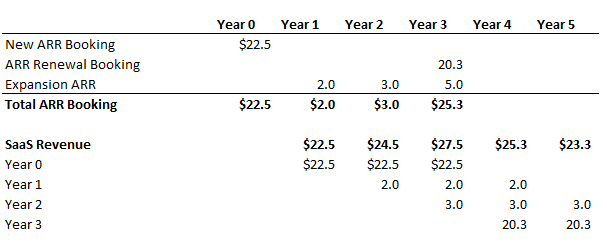
At a most basic level, in a contracted model (e.g. fixed price seats), rev rec is fairly simple. You book a 3 year deal, you recognize ratably over 3 years. The thing to note here is that it’s common to assume deal activity is quarter back-ended loaded in that a large volume of deals each quarter for an SaaS business selling to large enterprises are closed in the last week of the quarter so its typically a good practice to lag by 1 quarter. Selling to SMB will have much lower backend loading effects.
Renewals and NDR
Renewals are easy to understand on the surface but because the entire software industrial complex relies on renewals to survive, its actually become rather complicated.
At the most basic level, in the example above, a customer has signed a binding agreement to pay you for 3 years for the service. Outside of situations such as ‘termination for convenience,” where a customer has the ability to send notice to terminate within the term, this is “locked in".” At the end of 3 years, the customer can choose to renew or cancel.
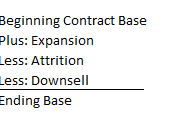
During these 3 years, the software company’s job is to get the customer to spend more. Maybe the customer grew in size or added employees, or maybe they’ll buy another product. Equally likely is the reverse causing downsizing in seats or divisions. So the concept of “Net Dollar Retention” is simple: to measure beginning period spend vs. ending period spend. If the numbers are equal, you have 100% NDR. Simple enough right?
Unfortunately, through business model evolution and craftiness, I can think off the top of my head at least 6 ways NDR is measured (I believe the actual variety is 11). For example:
Companies selling to SMBs often use monthly recurring revenue (MRR) to calculate because their contracts are month to month
Some will exclude foreign exchange fluctuations
Some report metrics for only certain cohorts of customers
Some will only report Gross Dollar Retention (showing only churn and downsell)
Some include usage from customer cohorts which can show significant fluctuation
Some don’t consistency disclose when the company is large enough (e.g. salesforce)
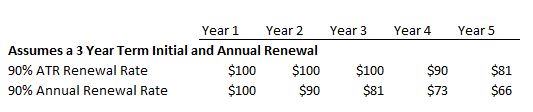
If we continue with the same numerical example, a simple revenue recognition schedule would look like this assuming that initial booking got renewed at 90% 3 years later:
Its important to draw the distinction with ANNUAL renewal rate vs. AVAILABLE TO RENEW (ATR). Available to renew is the measurement of actual renewals against the pool of contracts that are actually up for renewal. The numerical difference is significant, and since publicly available disclosure is focused on annualized renewal rate, its important to draw this distinction.
Quick Note on Consumption Ramp
It may be obvious but I continue to be surprised when I see models that assumes consumption ramp being modeled like seats (sign a deal, start to ramp in a quarter). Generally the larger the deal, the longer the ramp period. Take a AI model training on a hyperscaler use case:
A medium size AI workload likely takes 9-12 months to fully ramp. 1-2 months of provisioning, VPC setups, 2-3 months of migration planning then a gradual migration of workloads on the new cloud.
A large AI workload can be 2 years or longer. Oftentimes these deals are contracted based on a delivery timeline estimates of a datacenter location being ready (power availability), then GPU delivery milestones to follow. So the booking (and RPO recording) happens before a site may even be built which creates a lot of wait and see for investors.
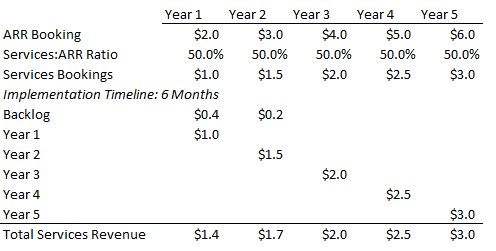
Professional Services Revenue
We generally think of PS effort as a function of product revenue. When PS requirement is low (as in SMB), the product is generally more standardized. When PS is high (like large ERP, banking or regulated industry), the product is usually heavily customized. The modeling intuition is not difficult to understand and is more of a function of headcount to scale. Services work are usually priced in 2 ways: (1) Time and Materials by the day or hour or (2) Fixed Priced, either in a statement or work or as a price list SKU. As an aside, there are Indian BPOs who are extremely profitable on professional services because they are able to hire in Indian markets then bill in US rates. Margin is a function of labor utilization and cost relative to pricing of the services work to customers.
Cost and Opex
Outside of the Sales cost, other cost items are not really worth a detailed discussion.
Cost of subscription generally include: Cost of hosting, support team, operations team managing the environment, the cost of 3rd party licenses used in the product
Cost of services is the headcount cost supporting PS work
R&D is primarily headcount between developers, QA, product management plus tooling and test environments. Its more art than science to gauge R&D efficiency because its predicated on the notion that you are building a product that will have broad customer appeal, and the ability of the team to iterate to change.
Sales is majority headcount and commissions
Marketing is a combination of events, analyst relations, brand marketing, ads and sponsorships
G&A are the backoffice functions
Its worth noting that most software company cost line items are fairly uniform and that all line item costs are typically fully burdened. Meaning, the rent, benefits, IT, overhead are loaded into the individual line items as opposed to sitting in G&A
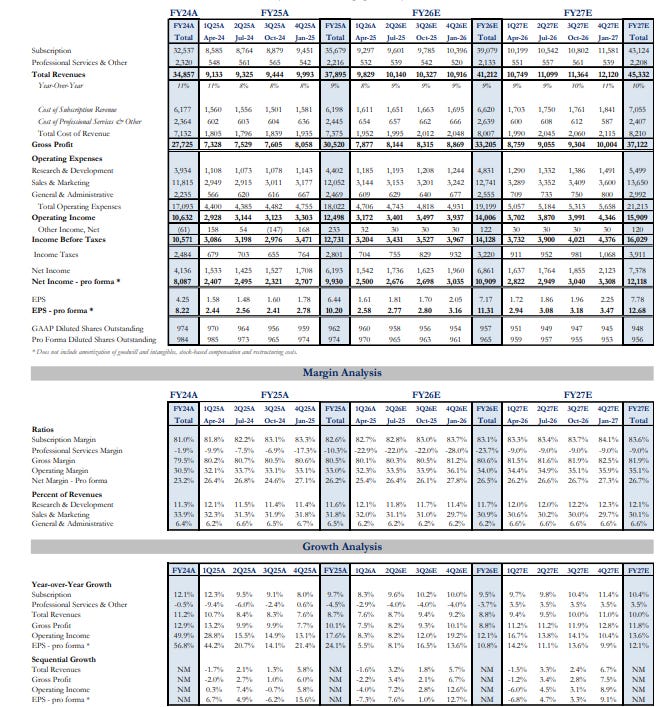
Here’s an example of a mature company income statement (CRM)
Working Capital
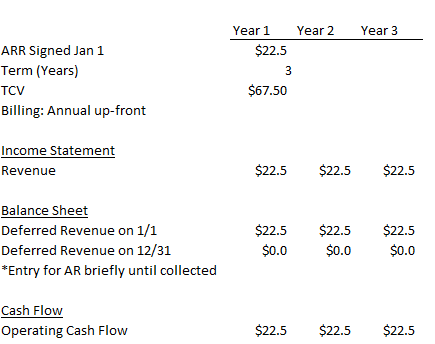
Putting this all together, if you assume the same $22.5M ARR deal with billing terms of annual billing up-front for a deal signed on January 1.
As you can see, as deferred revenue liability increases on the balance sheet, it is a source of cash.
Final (reluctant) Words on Stock-Based Compensation
When software investors talking about margins, we are usually talking about non-GAAP margins which excludes intangible amortization (M&A purchase accounting), 1x costs and stock-based compensation.
SBC in theory capture several types of securities, but in practice, majority of publicly traded companies have moved to RSUs for broad base employees, with options/PSU reserved for leadership
Restricted Stock Units (RSU): Employees get set number of shares that vest over a period of time.
Options: Contracts that let employees buy company stock in the future at a fixed price (strike price). By the time you vest, if the stock is below your strike price, that option is underwater. If it is above the strike price, you can cashless exercise for the net proceeds.
Performance Stock Units (PSU): Similar to RSUs but typically reserved for management. Instead of a time-based component, vesting typically depends on hitting a set of stock price return + financial metrics.
SBCs are excluded for non-GAAP measurement for a few reasons:
It’s non-cash
Timing of grants could create sizable volatility in the income statement
SBC is expensed over the grant period (service period) but employees who leave and terminated will lose the unvested amounts
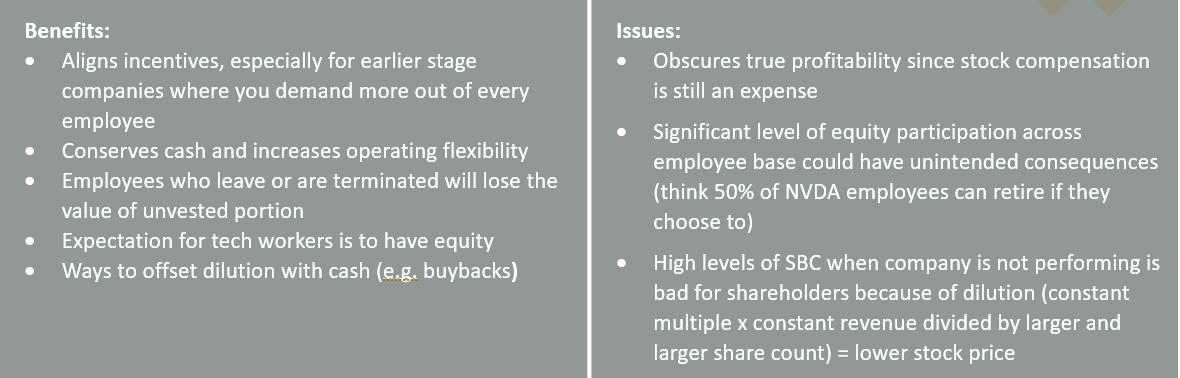
Whenever the market is down, we will hear a few months of lobbying against SBC add-backs. But rather than let my bias influence you, here are the classic pros and cons argument against SBC:
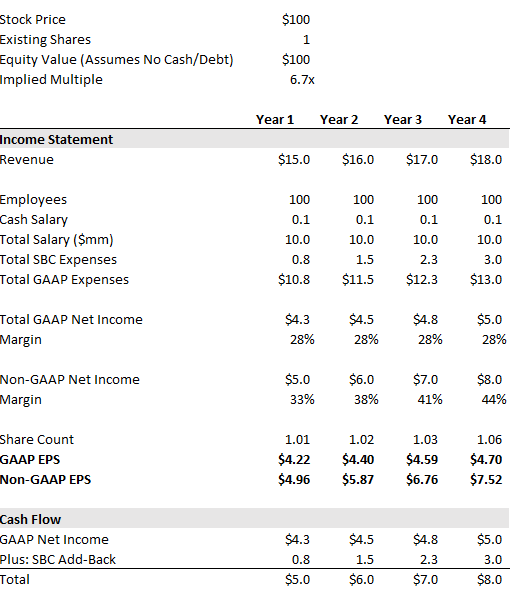
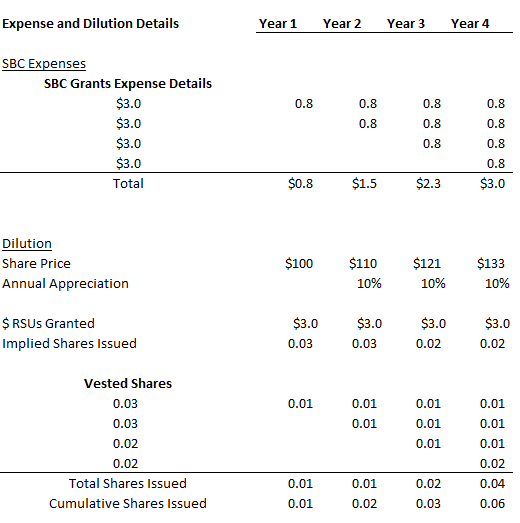
Model of SBC:
Using an example of a company with a stock price of $100 with 10% annual appreciation, 100 employees who are paid in $100k salary and $30k a year in RSU. RSU vests over 4 years in equal annual installments.
Details
If there are specific topics that could use more details, please let me know!
Perhaps you could further expand on modeling top lines for sw + when most appropriate to pay attention to billings vs rpo vs revs vs ARR when trying to back into bookings. positives and negatives/pitfalls of each.